Ven.u

A loyalty rewards app streamlining local concert discovery through artist and venue preferences.

01

Initial context

UX Designer // 3 Week Project

Ven.u is a Chicago-centric concert discovery app available in the App Store. The two founders, passionate live music fans, designed the product for themselves without performing user research or testing. They identified a business opportunity to supply concert attendee data to venues. At the project kickoff, the app collected this data through passive geofenced check-ins. It offered a virtual “shoebox of ticket stubs” to users by saving their concert history.

Ven.u planned to enhance users’ past concerts through potential new features. Their ideas included providing setlists and opening bands, as well as incorporating photos taken by users during the show. Their strategy was to sell venues on the ability of the app to target relevant consumers with promotional offers. Additionally, venues could reward users for frequent concert attendance. Ven.u challenged my team of three to design a solution customized to users’ needs while incentivizing consistent engagement, which would allow them to meet their business goals.

02

Getting acquainted

Tackling our first client project, my team met with Ven.u and identified our client’s key assumptions as a starting point. We broke down the users’ concert experience into assumptions related to the app’s current and future states:

Discovery
Reflection
  • The discovery market’s saturation makes it tough to differentiate
  • Current state:
  • Users want to browse upcoming concerts and save them to their calendar
  • Users want to follow general and local music Twitter feeds to stay informed
  • No competitor saves users’ concert history
  • Future state:
  • Users want to feel nostalgia as they relive the concert experience through Ven.u
  • Ven.u would differentiate through setlists, opening bands, or users’ own photos

We then outlined assumptions about our client’s direction for both users and venues:

Rewards
Business Plan
  • Users want to receive rewards for frequent concert attendance
  • Venues need a way to incentivize and reward return concertgoers
  • Users prefer passive check-ins reliant on enabled location services to save their history
  • Venues need a way to target relevant consumers with promotional offers

We summed up our client’s assumptions into the following initial hypothesis:

Concertgoers need a way to stay up-to-date on their favorite artists and genres, revisit show history with setlists from shows they’ve attended, and receive rewards for frequent attendance.

03

Surveying the landscape

We evaluated the live music digital landscape by analyzing 24 direct and indirect competitors. This resulted in market patterns related to the concert experience:

Discovery
Reflection
  • All but two competitors offered ticket purchasing
  • About a third of competitors provided upcoming event news or recommendations
  • Only a sixth of competitors delivered artist updates
  • No competitor saved users’ concert history
  • No competitor had a way for users to save their own past event media
  • Only a sixth of competitors provided photos or videos of past shows

During our initial meeting, Ven.u defined potential users as frequent live music attendees of small, local venues aged 18-45. We wanted to see how this compared to the demographics and behaviors of concertgoers across the United States. Concertgoers age 35-54 were the most active, representing 40%, followed by those age 18-34, representing 35%. We targeted this combined age range of 18-54, which made up 75% of all concertgoers. Bandsintown, a concert discovery app, studied behaviors of live music fans:

The study grouped concertgoers into five types based on their level of investment in social and musical experiences.

We hypothesized that the “Plugged-Indie” matched our target user. This group attends an average of 13 shows per year with 94% preferring small, intimate venues. We also examined the social media habits of North American concertgoers and compared them to the social media habits of Plugged-Indies. Looking at ways in which fans from the studies explored and remembered the concert experience gave us a frame of reference for Ven.u’s feature ideas.

Discovery
Reflection
  • 84% of concertgoing Facebook users liked an artist’s page
  • 73% of concertgoing Twitter users followed an artist
  • 73% of Plugged-Indies found a concert through an artist’s Facebook update
  • 73% of Plugged-Indies post photos or videos after the show on Facebook
  • 61% of concertgoers looked at photos and 51% looked at videos after the show
  • 21% of concertgoers looked at setlists after the show

04

Expanding on insights

We built on our research of concertgoers and their market by conducting ten user interviews. We recruited interviewees of diverse ages, all falling within our target range of 18-54. We also made sure our users were consistent concertgoers with an average attendance of one to two times per month. We asked both exploratory concert experience questions and specific Ven.u feature questions.

Testing our client’s assumptions led to insights then implemented in affinity diagramming.

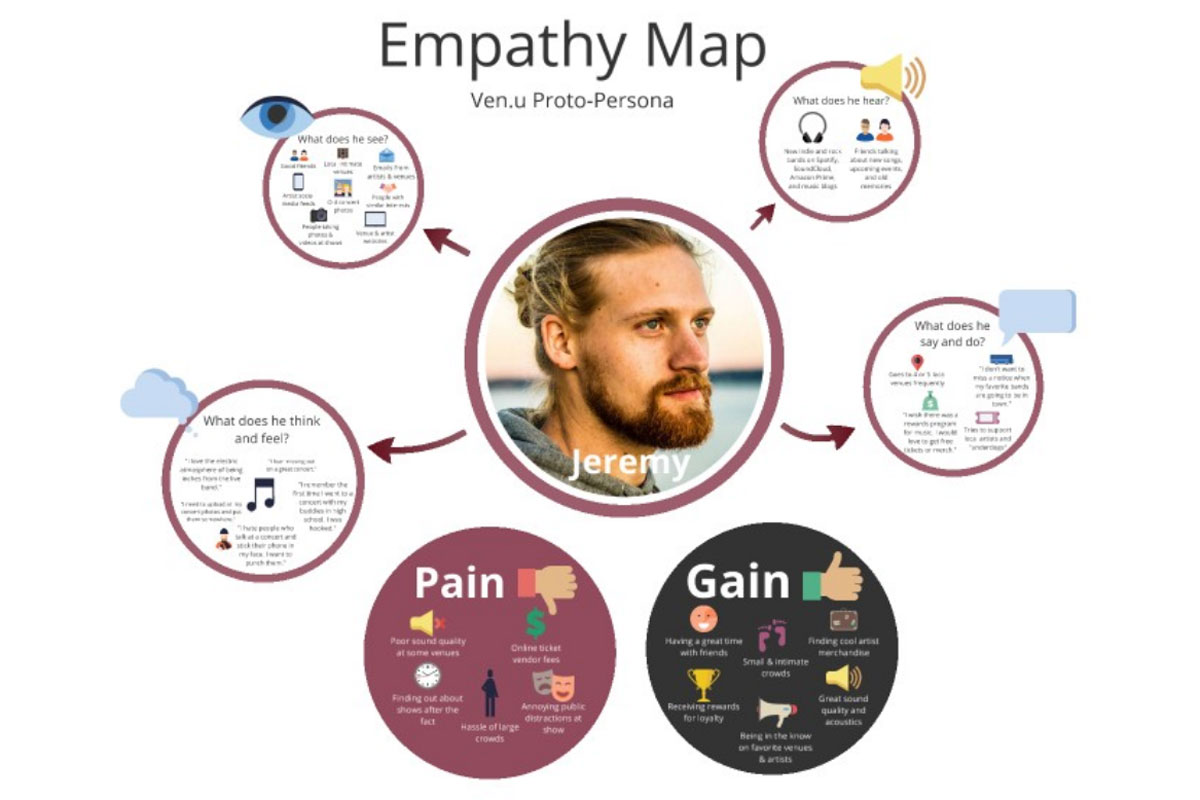
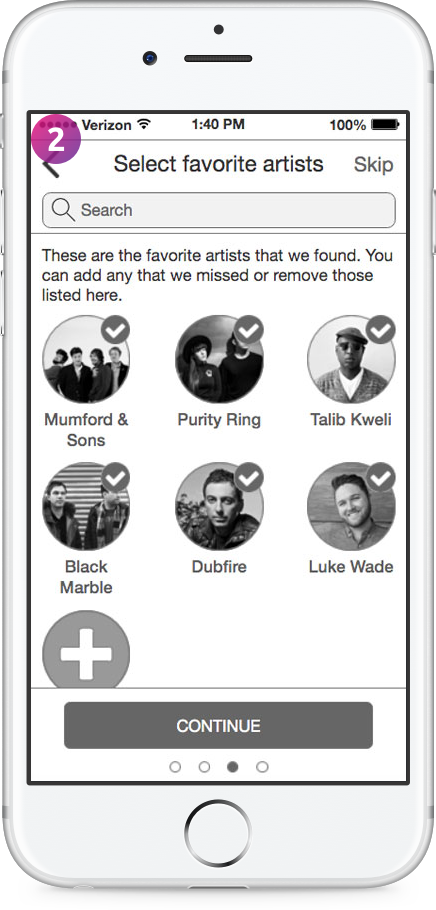
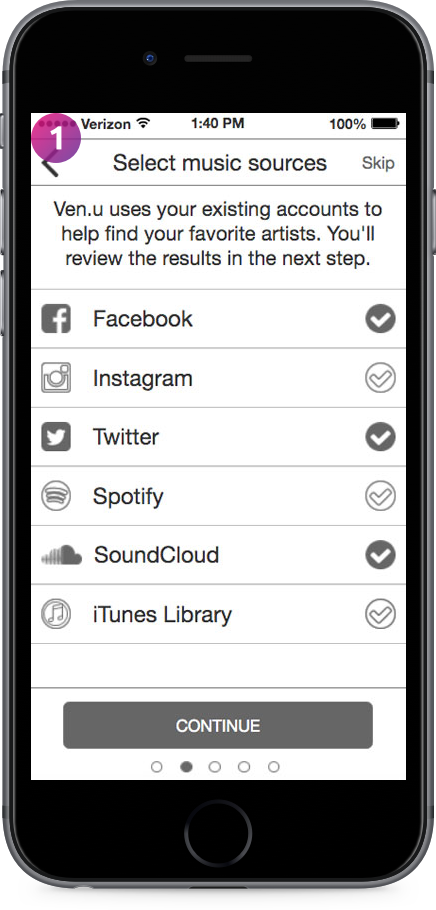
All users needed many methods to discover concerts. Users followed artist and venue social media accounts, checked websites, signed up for email newsletters, and consulted with friends. Four interviewees had used Bandsintown before. It was the only aggregate source app, which drew from users’ music and social media accounts to track their favorite artists. In contrast to our client’s assumption, users were indifferent towards concert reflection. Most users shared photos or videos on social media soon after the show. But revisiting them was an infrequent occurrence. Instead, it was popular for users to tell stories face-to-face with family or friends. Only half of users had ever looked up a setlist and only a few still collected ticket stubs.

Discovery
Reflection
“I use artist and venue email lists, check websites, and follow social media feeds.” - Chelsea
“I usually reminisce during conversations and will pull up photos and videos.”  - Anna

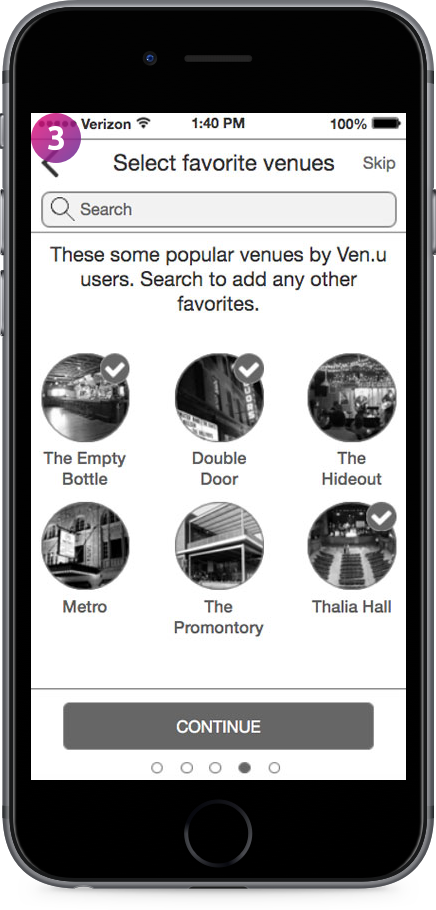
It was typical for users to frequent the same venues within their closest metro area or areas. Users preferred the intimate experience of small to medium-sized venues. They felt connected to the performance in a way that wasn’t possible in large crowds. For special events or favorites artists, they traveled farther or attended larger venues.

Venue Preference
“The Vic Theatre is my favorite. Artists that don’t tour very often come there because it’s a small venue and the atmosphere is electric.” - Paulette

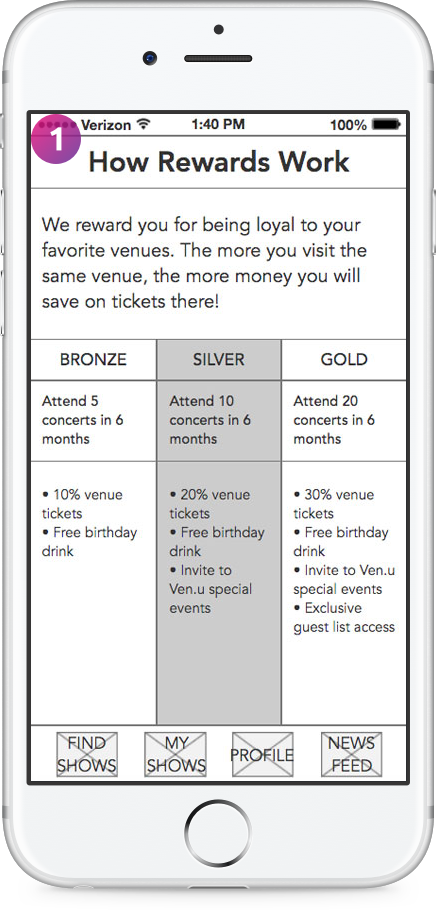
Users enjoyed rewards programs offering cash back or points. It was important to be able to use points for something they already wanted. One interviewee was enthusiastic about his past experience with a venue’s loyalty program. Our client researched that specific venue and mentioned it to us as a possible model.

Rewards
“At the 9:30 Club in DC, I collected points that I could redeem for merchandise, tickets, etc. If a venue here had a rewards system like that, I would sign up.” - Dane

Ven.u’s business plan relied on check-ins, but users had mixed feelings and habits relating to them. Some checked-in to save memories or share with friends. But others found it annoying, intrusive, or unsafe. We needed to conduct further research on this feature. To better understand the venue perspective, we immersed ourselves in the Chicago live music scene. Our goal was to learn about the dynamics between venue employees, artists, and their fans. We interviewed four industry experts:

Venues’ and artists’ main method for promoting shows is digital marketing. Facebook comes first due to its large audience. Both also use Instagram, Twitter, and email newsletters. While venues will sometimes work with artists to get fans to see their posts, it’s still more dependent on the artist’s following. Venues focus on offering a consistent product.

Discovery
Venue Preference
“Social media effectiveness depends on the band. Whether they have a presence and if they attract a demographic that uses social media.” - Sarah, PR
“My philosophy is to make it a venue where people want to go because the music is good night after night, not because it’s their favorite band.” - JB, Booking

Some venues have subscription-based membership programs, but those members don’t correspond to their most frequent fans. Instead of purchased benefits, venues wanted benefits that encouraged repeat concertgoers. With artists doing the marketing heavy lifting, we found a disconnect between the promotional attempts of artists and venues. There was potential for Ven.u to help bridge this gap.

Rewards
Business Plan
“I would rather have a most valued customer rewards program, where you get points for every time you come, rather than our current VIP program.” - Michael, GM
I have an ongoing relationship with specific venues, but it’s kind of upsetting that they often don’t do more to promote shows.” - Darrin, Drummer

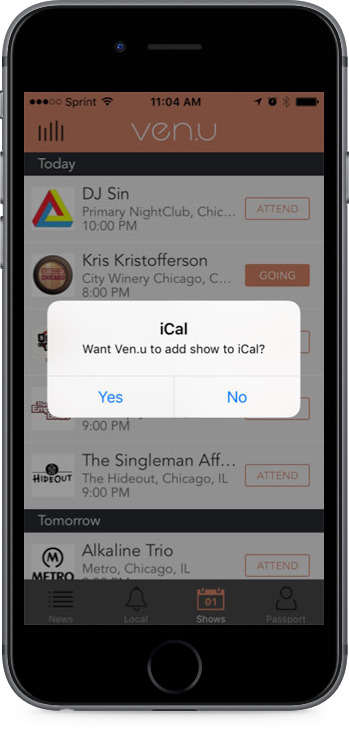
During six of our user interviews, we also conducted concept testing with the current state of the app. To prepare the team for potential pain points, we completed a heuristic evaluation.

Within a saturated market, Ven.u needed to match user expectations of essential features.
Discovery
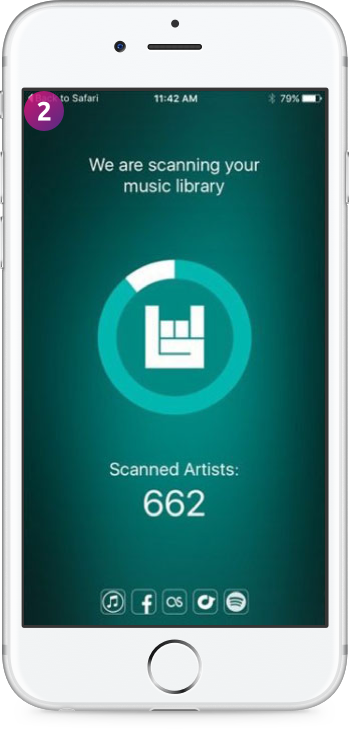
Personalization was necessary for users to find value in the news feeds.
Discovery
Venue Preference
  • Users wanted filters for the global feed, such as by location, genre, artists, or venues.
  • Users wanted the feeds drawing from their social media accounts’ likes and follows.
  • “I can’t filter and it’s a constant scroll. I have no say about what I get to read.” - Mike
  • Users preferred the local feed, approving of listed venues that included small bars.
  • “This is cool. I haven’t seen anything with real local stuff like this before.” - Jenna
  • “This would be useful. It would be nice to toggle between venues and artists.” - Dane
Users contradicted the assumed need to relive concert experiences. Enabling location services was crucial to Ven.u’s check-ins.
Reflection
Business Plan
  • Although users liked their show history, they didn’t find it useful or necessary.
  • “I’d be more interested in logging my photos and videos of each show.” - Tonia
  • Users would only allow location services if the app demonstrated value to them.
  • “I would like to get to know the app first before allowing location services.” - Paulette

05

Consolidating our findings

We synthesized the insights from our interviews into a proto-persona, Jeremy, to characterize our target user. We illustrated Jeremy through a combination of an empathy map and a journey map. Jeremy correlated with our hypothesized target user from the Bandsintown study, the Plugged-Indie.

After fleshing out Jeremy’s actions, thoughts, feelings, and environment, we prioritized his goals and frustrations. View the empathy map in more detail.
  • Goals:
  • Needs to be in-the-know and cover his bases about upcoming shows
  • Needs a quality concert experience with an intimate atmosphere
  • Frustrations:
  • Fears missing out on a memorable show from his favorite artists or at his local venues
  • Fears large crowds and annoying fan behavior might tarnish his concert experience

To understand our user’s behavior over time, we mapped Jeremy’s actions and feelings throughout the concert experience:

We explored opportunities for artists and venues to increase user engagement. View the journey map in more detail.

Jeremy’s stress tempers his excitement in the discovery phase. By relying on various sources for upcoming shows, he struggles to stay informed, so that he can get the experience that he wants. The concert is a hit, but his letdown in the reflection phase after the high from the show presents a missed opportunity by his local venue to capitalize on his enthusiasm and encourage future attendance.

To keep Jeremy and his journey in mind and the team on the same page, we developed design principles to guide our decisions:

  • Skip the email lists
  • Users’ confidence in prompt and authentic information reduces sources.
  • Finger on the pulse
  • Users feel connected and up-to-date with the local music community.
  • My favorites first
  • Users’ favorite artists and venues receive priority for show information.

Empathizing with Jeremy’s goals, frustrations, and feelings over the timeline of his concert experience led us to define the problem:

Concertgoers that frequent small to medium, local venues receive concert information from a variety of sources including email lists, websites, social media, and word of mouth. Concertgoers need prompt information from a personalized, aggregate source about upcoming concerts by their favorite artists at their preferred venues to ensure that they can experience live music in an intimate setting. Is there an opportunity to incentivize and reward concertgoers for venue loyalty?

We recognized opportunities in the overlap of goals and frustrations between users and live music industry players.

To communicate our direction to our client, I wrote three key questions that we needed to answer through iterative prototyping and testing:

Discovery
With so many sources and competitors for users, what are the differentiating factors?
Venue Preference
How can we give users the ability to weigh both artist and venue preferences?
Rewards
Are they an actual need or a nice-to-have? Should they be venue-specific or Ven.u-wide?

06

Testing, tweaking, + repeating

We then researched precedents of local venue websites, concert apps or websites, and rewards programs.

From this comparative analysis, we highlighted key takeaways to meet user expectations:

  1. Present chronological upcoming shows first with clear ticket purchasing
  2. Allow personalization with favorites drawing from music or social accounts
  3. Test cumulative versus tiered rewards systems with benefits at sign up

With our questions as a starting point, we ideated a list of features and sketched concepts to test. While exploring how to balance artist and venue preferences on paper, these forms of a venue emphasis were unsuccessful:

We built a prototype in Axure with versions of features for further concept mixed with A/B testing. Through that point, we had tested with six users. After condensing to a cohesive prototype, we conducted usability testing of task flows with an extra five users. All testers were consistent concertgoers and resided in Chicagoland.

We tested similar toggle and tab options for personalization in show and news discovery.
Discovery
Venue Preference
  1. Users preferred the stacked structure from left to right of artists, venues, and times.
  2. Users felt the chronological shows were intuitive but needed a section for newest listed.
  3. Users liked heart icons on show images but found them confusing on article images.
  4. Users worried that all news was too much. We clarified that it was all local news.
  1. Users wanted to favorite and unfavorite artists and venues on show listings.
  2. Users preferred separate favorite artist and venue buttons versus all favorites together.
In our final prototype, users could filter by their favorites on these two discovery screens.
Venue Preference
“This is the perfect situation to have both artists and venues.” - Sue Ellen
“I follow venues on Twitter, I would favorite them.” - Ned
We explored personalization during onboarding to improve discovery filtering.
Discovery
Venue Preference
  1. Users felt genre definitions varied and overlapped. Favorite artists were more accurate.
  2. Users selected prepopulated artists instead of opting out. The add icon was redundant.
  1. Early on, users were more interested in selecting favorite artists than venues.
In our final prototype, these three onboarding screens demonstrated how users would aggregate their preferences.
Discovery
Venue Preference
  1. Users loved the idea of linking various accounts for the app to pull their preferences.
  2. From other apps, users expected to be unable to continue without selecting artists.
  1. When absent from the flow, users requested adding favorite venues during onboarding.
Once we found an appealing rewards concept, users said it would be an incentive to keep using the app.
Rewards
Business Plan
  1. Users felt the venue-specific frequency was unattainable and didn’t care about tiers.
  2. Users preferred the Ven.u-wide points and liked the simplicity of punch card credits.
  3. Users agreed that they expected Ven.u credits to go towards the price of future tickets.
  • Starting onboarding with a rewards explanation and example points disoriented users.
  • Users needed more initial understanding of the product to enable location services.
  • Users said they would be more likely to use the app if they started off with points.
In our final prototype, onboarding started with an introduction to the value proposition of the app. It ended with a rewards explanation that only displayed points earned for signing up. View the full onboarding annotated task flow.
Rewards
“I didn’t even read it. I thought, ‘Money? Go.’” - Matthew
“The money is the best part. Ticket prices are crazy.” - Colleen
Users wanted notifications as shows approached if they had saved them as interested so they could buy tickets.
Users felt checking-in to earn points was easy. They liked that the notification brought them to their displayed points.
Business Plan
“A reminder could be, ‘Hey, this show you saved is coming up, are you still interested?’” - Paulette
“Awesome, I got double the points. I like the check-in. It wasn’t off-putting because I bought tickets.” - Ned

07

Measuring + advising

During our final client meeting, we presented our findings and handed off our deliverables. The details of our research engrossed our client. I created the site map and highlighted applicable portions of it throughout our slides. This addition helped our clients to follow along with our design changes. They appreciated how it zoomed in to show the location of individual screens within the app.

Even though our direction for differentiation of their MVP contrasted from their initial assumptions, it excited our client. Answering our revisited key questions allowed us to assess the value of our redesigned Ven.u:

Discovery

Ven.u differentiated by streamlining show and local news discovery through artist and venue favoriting. This aggregated information from emails, websites, and social feeds for users.

Venue Preference

Ven.u allowed users to weigh both artist and venue preferences through separate favorites sorting for discovery. This combination wasn’t available in other concert apps or websites.

Rewards

Rewards were a need to make Ven.u viable and should be app-wide. This has the potential to attract new users and keep them engaged.

These outcomes worked together to meet our client’s business plan. We then advised them with future recommendations. Building on testing, these ideas are the next logical steps to explore.

Discovery

To further increase flexibility in personalization, users could favorite at more touchpoints. This could include screens providing show details, artist details, and venue details. Also, the news feed’s mixed feedback was not conclusive. Throughout the project, we heard both positive and negative extremes, requiring further testing for validation.

Rewards

To further attract and incentivize users, Ven.u could gamify the rewards system. To help make it fun, users could earn bonus points for promotional offers, sharing check-ins on social media, or check-in streaks. Other options for redeeming credits could include access to ticket presales, gifting credits to another user, or venues’ food, drinks, or merchandise.

Business Plan

To further target users with notifications, Ven.u could send key artist and venue announcements, nearby favorite artists, or calendar reminders. They should conduct further testing to determine the frequency and content, so they don't annoy users. Separate settings for different types of notifications could increase customization.

08

Final reflection

As my first client project, it was challenging to differentiate while working in an oversaturated market. Conducting interviews with local industry stakeholders helped us to identify an unmet need targeting specific users. If we had more time, I would have pushed to work towards a more consumable layout for our show listings. We didn’t consider variations and extremes in source content, such as a show not having available images or names too long for the available space. One user referred to the favoriting hearts as “everywhere and overwhelming.” There also could have been more visual consistency between the show listings and saved shows.

I learned the importance of not losing my voice within a team that didn’t mesh well. Due to the dynamics, I spoke up less. In my next client project, eRetirements, I prioritized continuing to advocate for my perspective throughout. A significant addition to my design process was learning to balance user needs with business objectives. To attract new users, we needed to communicate the value proposition during onboarding. Rewards encouraged location services permission and kept users engaged, which would allow Ven.u to meet its business goals. To read more about my design process evolution, check out my previous project, Simple Slice.